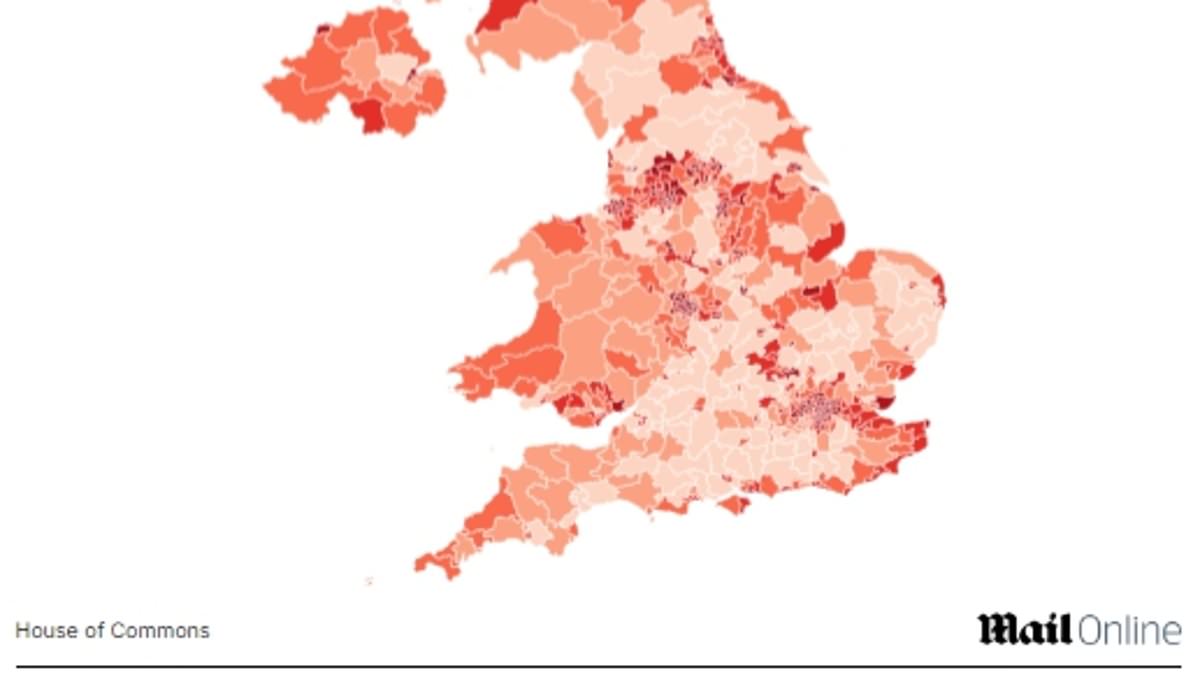
The parts of Britain with the highest rates of unemployment benefits claims have been laid bare in maps – with some areas seeing a rise of a third over the past year.
Analysis by the House of Commons library shows the hotspot constituencies across the UK, with more than 1.8million people getting government support.
Birmingham and London dominate the top 20, with the West Midlands seat of Perry Barr the highest. Some 16.3 per cent of the working age population there receive unemployment benefits.
Although many of those claiming will be in jobs, the data suggests that the rising cost of living has been leaving increasing numbers struggling to get by.
Separate ONS figures have highlighted the scale of the long-term sickness and inactivity crisis faced by the country after Covid, with alarm that younger people are staying out of the workforce.
Birmingham Perry Barr
Claimant rate October 2024: 16.3%
Annual percentage rise: 31%
Birmingham Ladywood
Claimant rate: 14.9%
Annual percentage rise: 32%
Birmingham Hall Green and Moseley
Claimant rate: 12.3%
Annual percentage rise: 41%
Bradford West
Claimant rate: 35%
Annual percentage rise: 12.2%
Birmingham Yardley
Claimant rate: 12%
Annual percentage rise: 42%
Birmingham Hodge Hill and Solihull North
Claimant rate: 11.5%
Annual percentage rise: 41%
Bradford East
Claimant rate: 11.5%
Annual percentage rise: 41%
Birmingham Erdington
Claimant rate: 11%
Annual percentage rise: 21%
Brent East
Claimant rate: 9.8%
Annual percentage rise: 27%
Tottenham
Claimant rate: 9.6%
Annual percentage rise: 21%
The UKs seasonally-adjusted claimant count stood at 1.81million last month. It represents people aged 16-64 receiving unemployment-related benefits – but many will be in jobs and receiving income top-ups.
That was 26,700 more than September, and 253,100 more than the same month last year.
Numbers have gone up 575,800 since March 2020, when they stood at 1.23million.
Before 2016 the trend in unemployment benefits closely followed the unemployment figures.
However, since then the rollout of Universal Credit means more people are required to seek work to claim.
The claimant count saw a sharp increase after the pandemic hit, rising by 1.43million between March and May 2020. It hit a high of 2.7million in August 2020.
Although the level fell back through 2021 and the first half of 2022, it has remained stubbornly above pre-Covid numbers – and saw a significant rise over the past year.
The breakdown by constituency shows that Birmingham, which already had some of the highest claimant rates in the country, has seen some of the biggest increases.
In the Hall Green and Moseley constituency the level has risen by 41 per cent, while Hodge Hill and Solihull North has seen the same proportional bump.
In Birmingham Ladywood the rise was 32 per cent, taking the claimant rate to 14.9 per cent.
And in Birmingham Yardley the annual change was 42 per cent, with the rate reaching 12 per cent.
In Bethnal Green and Stepney the claimant rate has gone from 6.1 per cent to 8.4 per cent in a year, equivalent to a 37 per cent increase in numbers.
East Ham has seen a 38 per cent rise, taking the claimant rate to 9.5 per cent.
Bradford East recorded a 41 per cent increase, and Bradford West 35 per cent.
The hike in Dewsbury and Batley was an eye-watering 45 per cent, albeit the claimant rate remained lower than many other seats at 7.9 per cent.
